


Details and Benefits of a Design-Phase Pile Test Program
by Ben White, P.E.
An intensive design-phase pile test program saved significant time and money on the I-480 Valley View Bridge project near Cleveland, Ohio. The design-build team of Walsh Construction and CH2M (now Jacobs) developed the pile load test program and contracted GRL to perform the testing and analysis. The test program’s goal was to optimize the driven pile foundations for 12 substructures and take advantage of significant soil set-up in the glacial silts and clays of the Cuyahoga River Valley. Soil set-up is an increase in soil resistance with time. The increase in soil resistance is due to soil remolding around the pile and pore water pressure dissipation after pile installation.
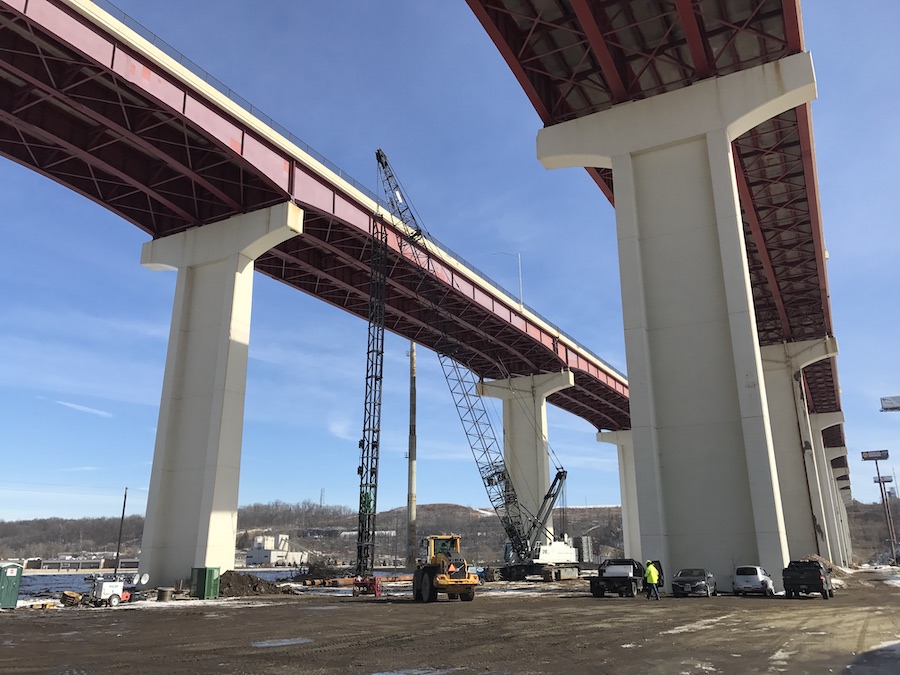
The intent of the design-build project was to construct a third bridge structure between two existing structures. While no exact amount of savings has been calculated, the new structure was completed with approximately 64,000 lineal feet (19,500 lineal meters) of piling in the 12 substructures and had 66,000 lineal feet (20,100 lineal meters) LESS than the existing structures. Furthermore, by only considering the end of drive soil resistance and ignoring soil set-up, it was estimated that an ADDITIONAL 105,000 lineal feet (32,000 lineal meters) of pile would have been required.
The pile test program included 24 test piles. The piles were tested during initial driving, short term restrikes, and long term restrikes. In addition, three static load tests were performed. The test piles were 18” (460mm) diameter, closed end pipe piles installed with an ICE I-46 diesel hammer.
 Initial drive testing indicated significant variability in the soil resistance to driving across the site. End of drive resistances ranged from 234 kips to 834 kips (1043 kN to 3720 kN), with final depths ranging from 90 feet (27m) to as much as 225 feet (68m). Short term restrikes were performed using the I-46 hammer and were typically performed one to seven days after the pile was installed. After just a few days, a tremendous amount of soil set-up was observed. During short term restrikes, the soil resistance was generally two to six times the end of drive soil resistance.
Instrumented static load tests were performed at three pier locations across the site. Each pile had 12 to 15 strainmeters installed on a center bar in the concrete filled pile. The load tests were designed to reach as high as 2000 kips (8920 kN). The embedded instrumentation was used to evaluate the soil resistance distribution to relate to and compare with the CAPWAP analysis results for the other test piles in the program. The static load tests indicated soil resistances of 945, 1495, and 1870+ kips (4210, 6670 and 8340 + kN) roughly 30 days after installation.
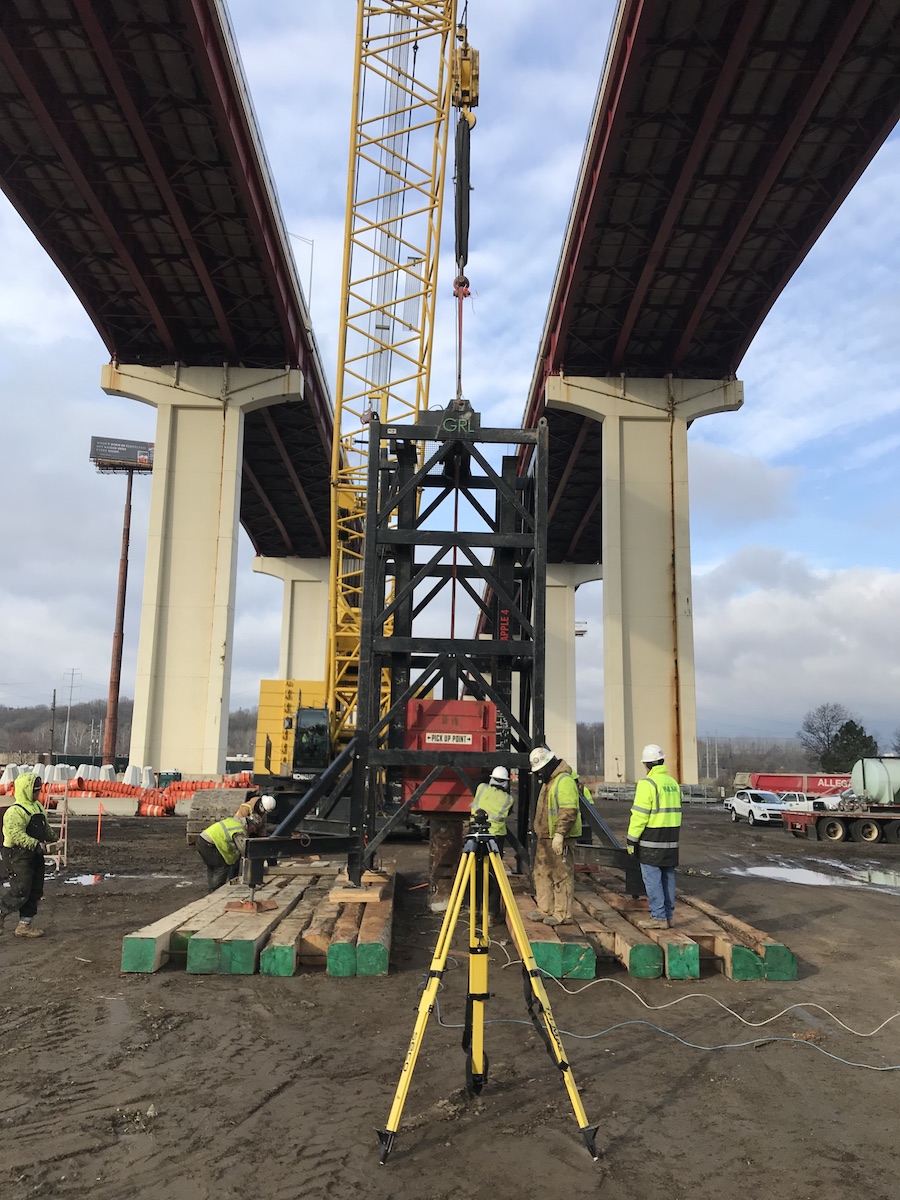
Long term restrikes were performed 28 to 56 days after pile installation. Since the pile hammer could not mobilize the full soil resistance, the restrikes were performed using GRL’s APPLE 4 drop hammer utilizing a 28 ton drop weight. During the long term restrikes, the soil resistance was roughly 4 to 12 times the soil resistance at the end of driving. Soil set-up curves, consisting of quantified soil set-up vs. depth, were developed from the load test program data.
An immense amount of data was collected and analyzed during the pile load test program. Additional dynamic testing was performed at each pier during production driving. Short term restrikes were compared to the pile test program results and the performance of the production pile hammer was evaluated. Depth dependent driving criteria were established for each substructure using the test program and production dynamic test results, as well as Wave Equation analysis results using the GRLWEAP program. The deeper the pile was installed, the more soil set-up would occur, and therefore the target capacity at the end of driving, and the required blow count decreased. This method took full advantage of the soil set-up curves developed during the test program and the measured hammer performance during production pile driving.
This pile test program is an excellent example of the use of modern testing and design methods to optimize pile foundations. Properly implemented pile load test programs frequently produce substantial project cost savings. Such programs should be considered for any significant pile foundation project.