

The State of America’s Infrastructure – Part II
View the complete article here.
View Part I here.
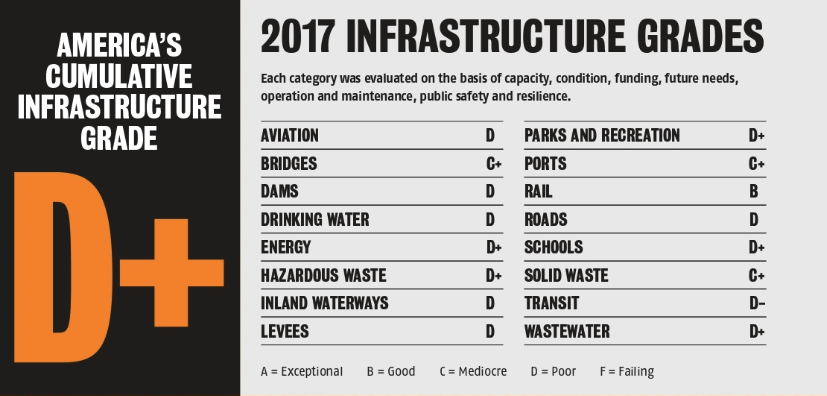
Pile Buck published its special “Trumpistructure” edition after the presidential election in 2016. At the time, the most recent American Society for Civil Engineers (ASCE) report card from 2013 gave America’s infrastructure a grade of D+. Unfortunately, as we approach 2020, America’s infrastructure grade remains stubbornly at a D+.
While gridlock in Washington remains the same, the money needed to fix America’s infrastructure woes has not.
Every four years, the ASCE puts out a detailed set of reports on the state of infrastructure in the USA. The 2013 report card estimated it would take $3.6 trillion by 2020 to get America’s infrastructure – including road, bridges, and waterways – up to snuff.
In 2017, the estimate rose 27.5 percent to $4.59 trillion.
To be fair, the most recent report card was issued in 2017 – within the first year of the Trump administration. Much of the analysis was based on projects and needs assessments prior to President Trump being sworn into office.
Delaying to fund infrastructure improvements will only see the costs rise in the interim. We encourage governments and industry at all levels to sit down and find ways to raise the monies, innovate to use new technologies and materials to lower costs, and sharpen project management methods to shorten construction times-to-completion.
A Wide Range of Infrastructure
There are 16 infrastructure categories in the ASCE’s report: aviation, bridges, dams, drinking water, energy, hazardous waste, inland waterways, levees, ports, public parks, rail, roads, schools, solid waste, transport, and wastewater.
What’s in a Grade?
The ASCE Committee on America’s Infrastructure is comprised of 28 civil engineers. The team consults with experts and reviews existing data to develop its broad and detailed report. The ASCE gives an overall grade for the country and an overall grade for each category. Then, each state is graded overall and by category. Each grade is based on:
- Capacity: Can the infrastructure handle the level of use today and in the future?
- Condition: Is the infrastructure in good working order and will it remain so in the near future?
- Funding: Actual verses Estimated.
- Future Need: How much money is needed to improve the infrastructure and how likely this funding will be provided?
- Operation and Maintenance: Do the owners have to ability to operate and maintain the infrastructure? Does the infrastructure meet all government regulations?
- Public Safety: How does the present state of the infrastructure impact public safety?
- Resilience: What is the infrastructure system’s capability to protect against significant threats? Can it quickly recover and provide its citizens with critical services?
- Innovation: What new and innovative techniques, materials, technologies, and delivery methods are being implemented to improve the infrastructure?
Infrastructure Needs by State
The ASCE has a great feature called the Super Map[1]. Click a category then click a state on the map to see the grade and report for that type of infrastructure. For example, in Iowa 5,067 of the 24,215 bridges (20.92 percent) are structurally deficient. You’d think this would rate them an F in this category. But, the ASCE gave them a D+, probably because in 2015 lawmakers coughed up enough funds to fix the state’s worst highways and bridges.
By contrast, Florida earned a B grade in the bridges category. Only 265 of the 12,355 bridges (2.14 percent) are structurally deficient. Before you sell your home and move to Florida, the state earned a D+ in its coastal infrastructure. Nearly 61 percent of Florida’s beautiful sandy beaches are eroding.
It Isn’t All About the Benjamins
Some infrastructure improvements require little money and no construction.
Houston increased its bus and light rail ridership by 6.8 percent simply by redesigning their bus network. They transitioned to a more grid-like system from the previous hub-and-spoke design. As a result, 95 percent of Houston residents can catch a bus within a quarter-mile from their home.
In Oklahoma and Texas, unmanned aerial vehicles (UAVs) are now used to inspect rail infrastructure in remote areas. This comes in handy when floods wash away tracks. UAVs outfitted with high-definition video are flown over the flooded areas. Rail inspectors can then review the footage on dry land. This reduces inspection costs and increases safety by not sending inspectors out to remote or flooded locations.
Focus on: Bridges and Inland Waterways
To get a sense of the issues surrounding America’s infrastructure problems, we shine a spotlight on two reports: Bridges and Inland Waterways.
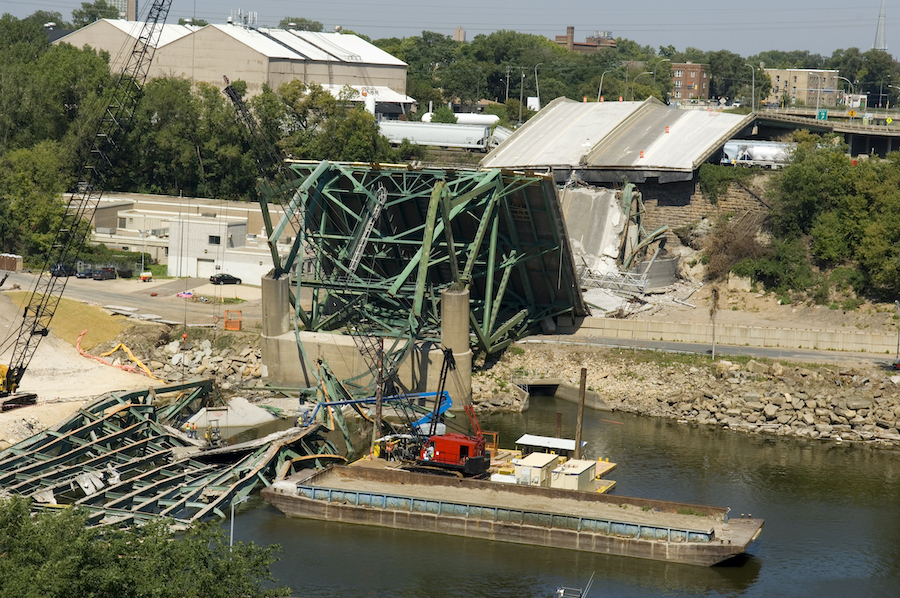
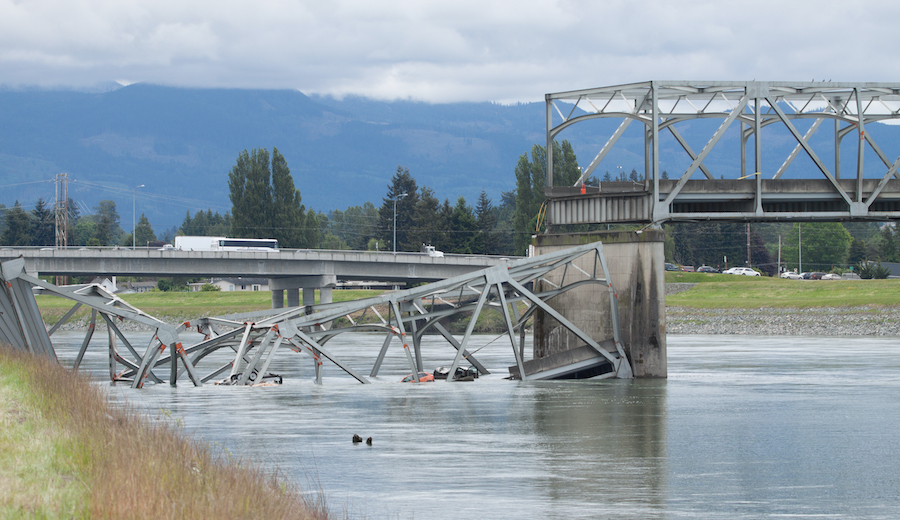
Innovations in Bridge Construction
Lack of funds tends to foster innovation. New technologies and materials have been developed to speed up bridge construction – and make bridges that are stronger, need less maintenance, last longer, and self-diagnose.
- Sensors provide information on structural conditions 24/7.
- Ultra-high-performance concrete, steel, and composites are making bridges stronger and they last longer.
- Pre-fabrication of some bridge parts reduces traffic disruption.
Unfortunately, across the USA funding for bridge construction and repair is sorely lacking. Both the 2013 and 2017 ASCE report cards give the country’s bridge category a D+. But during the report card interim, the estimated amount of money needed to fix America’s bridges nearly doubled – from $78 billion to $123 billion.

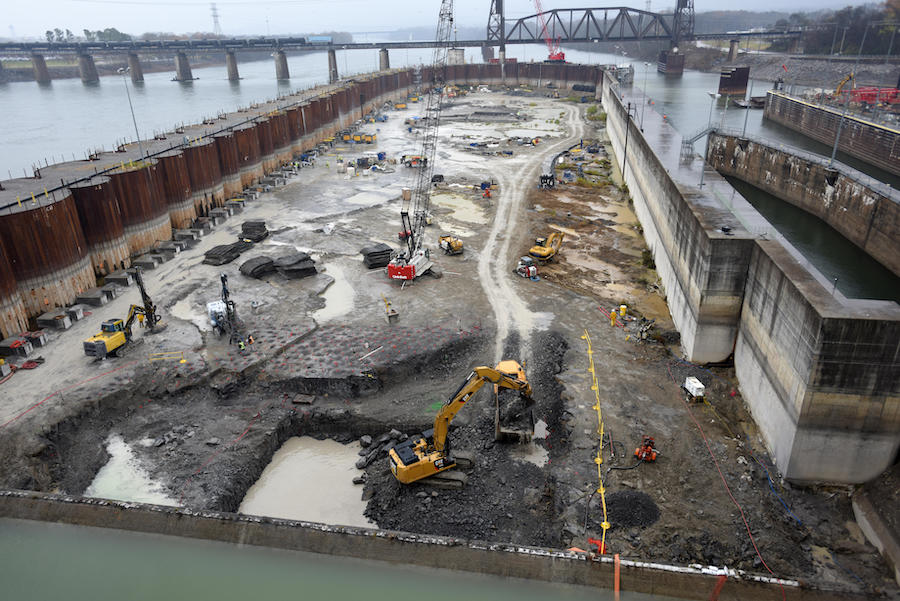
America’s Inland Waterways
The U.S. Army Corps of Engineers operates and manages 25,000 miles of inland waterways. In a global economy, America’s water highway provides access to international markets.
In 2015 alone, 575 million tons of cargo worth $229 billion traveled along U.S. inland waterways. Yet, 49 percent of vessels were subject to delays.
The locks and dams that are part of the system are well past their planned 50-year expiration date. The good news is that the time to complete some rehabilitation projects has been cut by over 50 years. Projects once slated for completion in 2090 are now scheduled to be completed by 2038.
Big and Bold
There are some huge infrastructure projects happening right now.
La Guardia Airport, New York
This $8 billion redevelopment project is keeping the planes flying by building a new airport right on top of the old one! In addition to 8 miles of roadway and 24 new bridges, a new Central Heating and Refrigeration Plant (CHRP) will handle the heating and cooling equipment for Terminal B. Most of the money (80 percent) for this project is from private funding. Estimated completion is 2022.
Sound Transit 3 (ST3), Seattle-area, Washington
In 2016, voters passed the $54 billion mass transit project. Light rail will be extended 62 miles and 37 stations will be added. Ridership will be extended to suburban areas. Estimated completion is 2041.
New Sixth Street Bridge, Los Angeles, California
Plagued by cost increases and project delays, the New Sixth Street Bridge is slowly moving forward. The 84-year-old Sixth Street viaduct was torn down in 2016. The new bridge will consist of 10 pairs of continuous arches along the 2,867-foot-long viaduct. It will be the largest bridge in Los Angeles history. Estimated completion is now 2022.
Drinking Water Projects
From Michigan to New Jersey, lead-tainted water has been in the news for years. Earlier this year, the EPA announced new funding for Water Infrastructure Finance and Innovation Act (WIFIA) loans.
The combination of public and private funding is meant for construction-ready projects to protect drinking water, fix aging infrastructure, and promote water recycling. As of March 2019, $2 billion in loans have been issued to help finance $4 billion water infrastructure projects. It is estimated that these projects will create over 6,000 jobs.
 Raising Funds for America’s Infrastructure
 Raising Funds for America’s Infrastructure
Since 1993, Americans have been paying a user fee of $0.184 per gallon on gas and $0.244 per gallon on diesel fuel. ASCE also recommends tying the fee to inflation.
In 2015, Pile Buck addressed the lack of infrastructure funding by proposing, in part, an increase in the federal motor fuel tax.
We also recommended basing the tax on a percentage of the total sale rather than a fixed cost per gallon. (This makes some sense as gas prices fluctuate greatly, although a per- gallon-fee makes estimating revenue easier.)
ASCE agrees with increasing the user fee. To enable the Highway Trust Fund to cover the cost of fixing America’s roads and mass transit, they recommend increasing current user fees by at least $0.25 per gallon.
In 2018, the Tax Policy Center reported that if the user fee had been indexed to inflation back in 1993, the user fee would now be $0.31 for gas and $0.42 for diesel.
It Takes a Country
The ASCE’s 2017 Infrastructure report contains some bold – and costly – ideas to fix America’s roads, bridges, waterways, and the entire infrastructure on which each and every person depends. In addition to raising the federal motor fuel tax, ASCE believes the investment gap of $206 billion a year can be closed by:
- By 2025, increasing government and private sector investment from 2.5 percent to 3.5 percent of U.S. Gross Domestic Product (GDP).
- Sufficiently fund dedicated infrastructure sources with user-generated fees.
- Making sure dedicated infrastructure funds are never used to cover shortfalls in other parts of a government’s budget.
- Focusing on and specifically funding those categories of infrastructure that are highly deficient.
- Owners and operators charging fees that reflect the actual cost to maintain and improve the infrastructure on which American lives and livelihood depend.
Wrap Up
America can solve its infrastructure problem with a combination of increased funding, better project management, and innovation. The time to stop talking and start doing is now.
Together, with focus and commitment, this can be accomplished.
We are still hopeful that funding sources will be found and the next ASCE infrastructure report card gives America a much higher grade.
View the complete article here.
View Part I here.
Why is America's infrastructure graded, and what does the grade signify?
America's infrastructure is graded by the American Society for Civil Engineers (ASCE) based on factors such as capacity, condition, funding, future need, operation, maintenance, public safety, resilience, and innovation to assess its overall health and performance.
How can individuals find out the infrastructure grade for specific states and categories?
The ASCE provides a Super Map feature on their website, allowing users to click on a specific category and then a state to view the infrastructure grade and detailed report, providing insights into the state of bridges, roads, waterways, and more.